Getting started with Checkly Traces and OpenTelemetry
Checkly Traces are OpenTelemetry native and available on all plans. Need help getting started? We offer a free, 1:1 onboarding service to help you instrument your stack with the correct OpenTelemetry SDKs and enable tracing inside Checkly. Book an onboarding session right here.
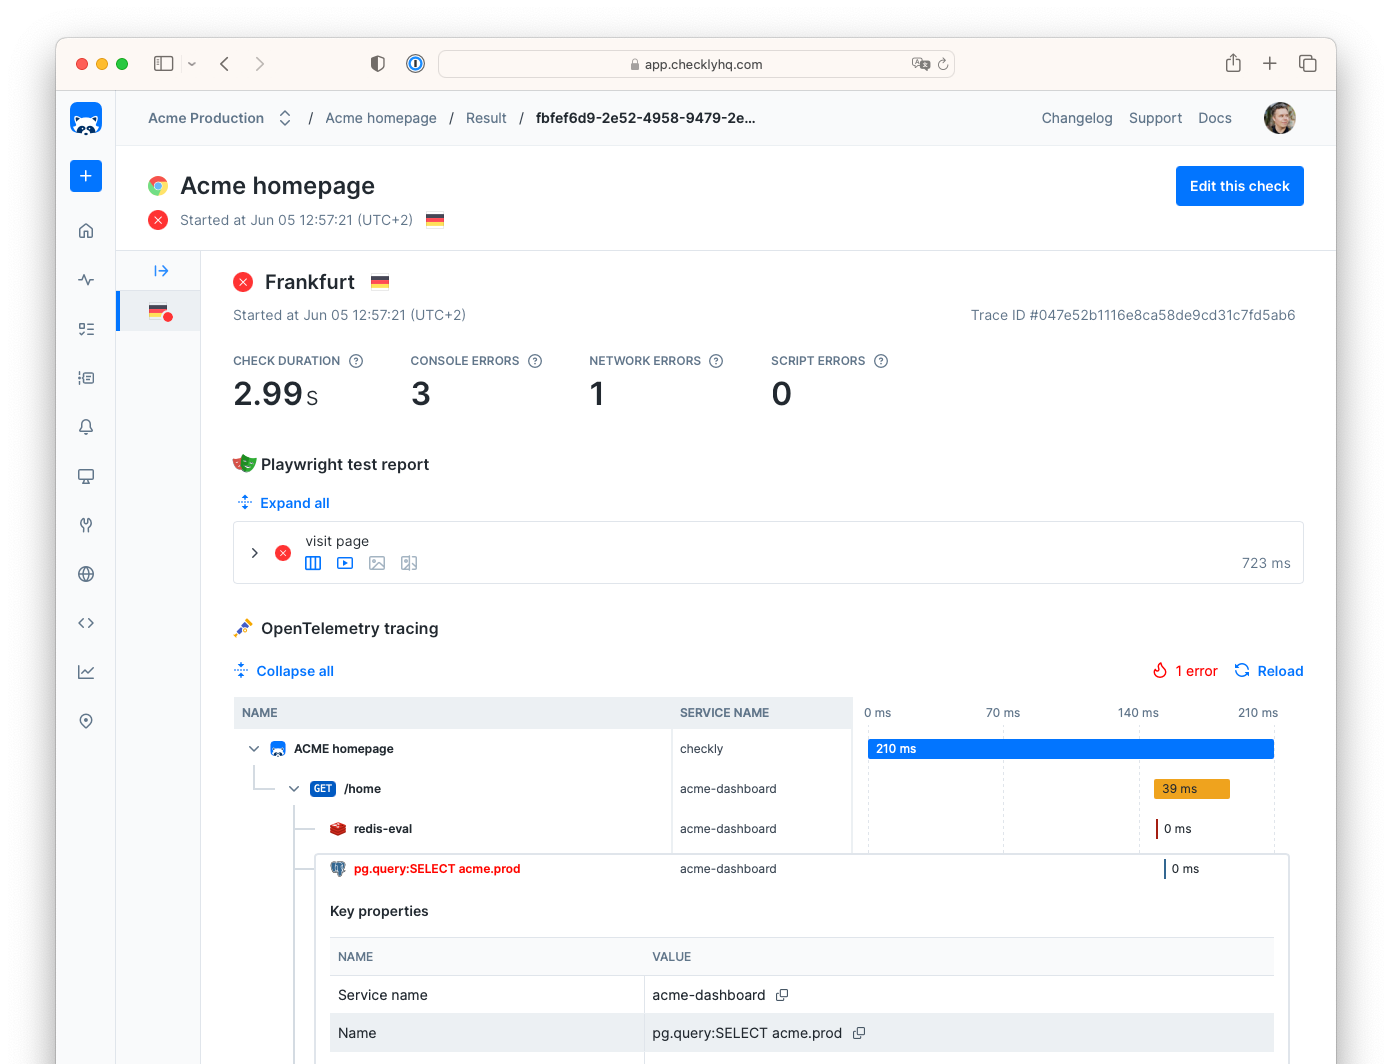
With telemetry traces configured, you will have access to traces in all the places where it matters to more quickly resolve issues:
- Check results: resolve production outages faster by correlating failing checks with infrastructure traces.
- Test sessions: understand any failures during test session execution.
- Check editors: get a live trace while building, editing and debugging check code.

To get started with Checkly Traces using OpenTelemetry, pick the scenario that best fits your needs.
 I don't have an OpenTelemetry setup
Instrument your app and send traces directly to Checkly. No need for a 3rd party OTel backend.
 I already have an OTEL Collector
Send your infrastructure traces to Checkly to get contextualized check failure analysis.
 I want to export Check results to my OpenTelemetry setup
Export check results as traces to your 3rd party OTel tooling
See this in action in the video below:
If you want to learn more about how this all works, check out the Understand Checkly Traces section.
Last updated on August 20, 2025. You can contribute to this documentation by editing this page on Github